We have a new way for you to upload your photos!
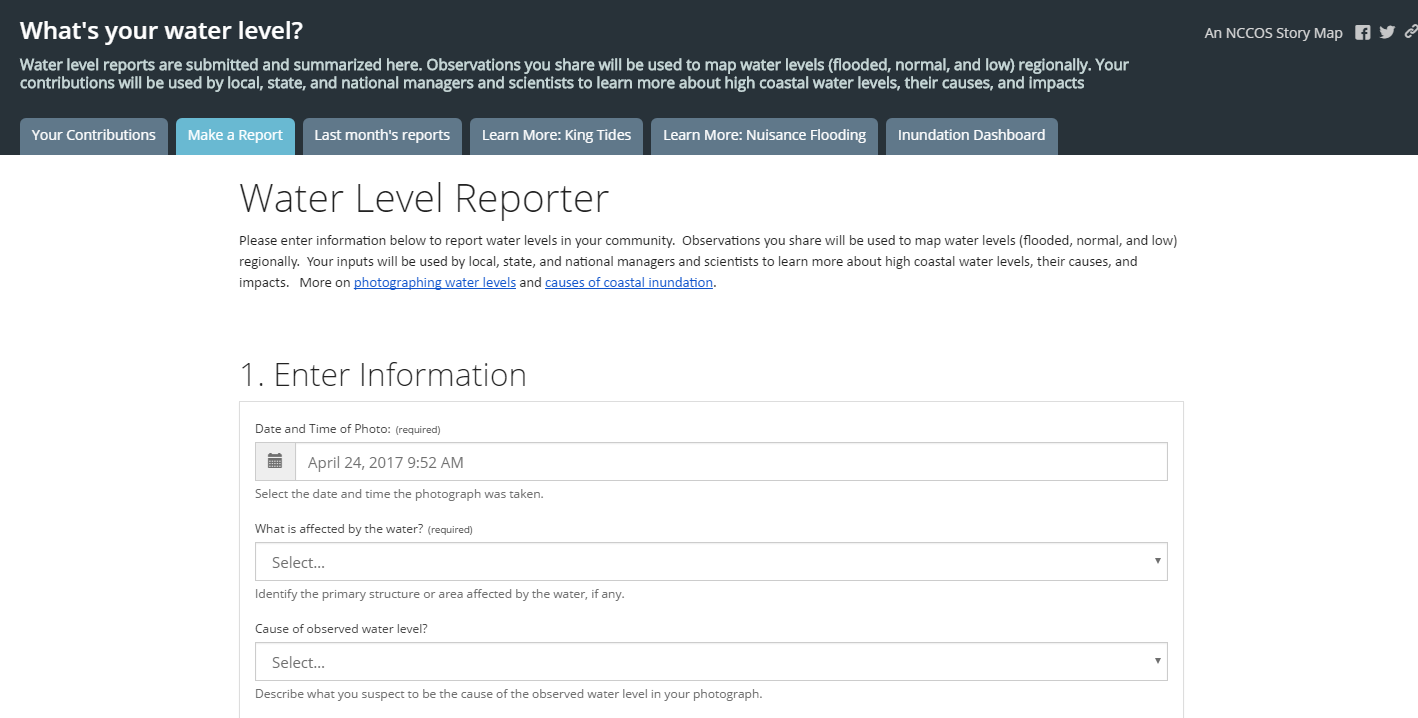
“What’s your water level?” is a new web-based app from NOAA that has been developed to assist in collecting and displaying photographic water level contributions from citizen scientists in real-time. These photos will help weather predictors, scientists, and the public to visualize and understand the impacts of changing water levels.

This storymap is a great development for NC King Tides participants because it displays a summary of all the contributions in real-time, not just from our project here in North Carolina, but from high water events all over the United States. In addition, the water level reporter will include water levels affected, not just by tides, but also by dam failures, high rain events, water main breaks, etc.
So now, you can see what’s happening with water level all across the country!
We want you to help us continue our effort to photograph high water events by posting your photos to the new “What’s your water level?” page. You can find more information on uploading your photos to the new reporter here. Mobile app to follow soon!
0 Responses to “What’s Your Water Level? (April 24, 2017)”
page lowry
We live on the Brunswick River, a tributary of the Cape Fear River, and have been experiencing unusually high tides for the past few months. Are you interested in photos?