NOAA has introduced a new beta version of their Sea Level Rise Viewer that allows you to view local scenarios and vulnerabilities.
This map tool helps to visualize community-level impacts from coastal flooding and/or sea-level rise. There is data on water depth, flood frequency, socio-economic vulnerability, vegetation loss and migration, and more!
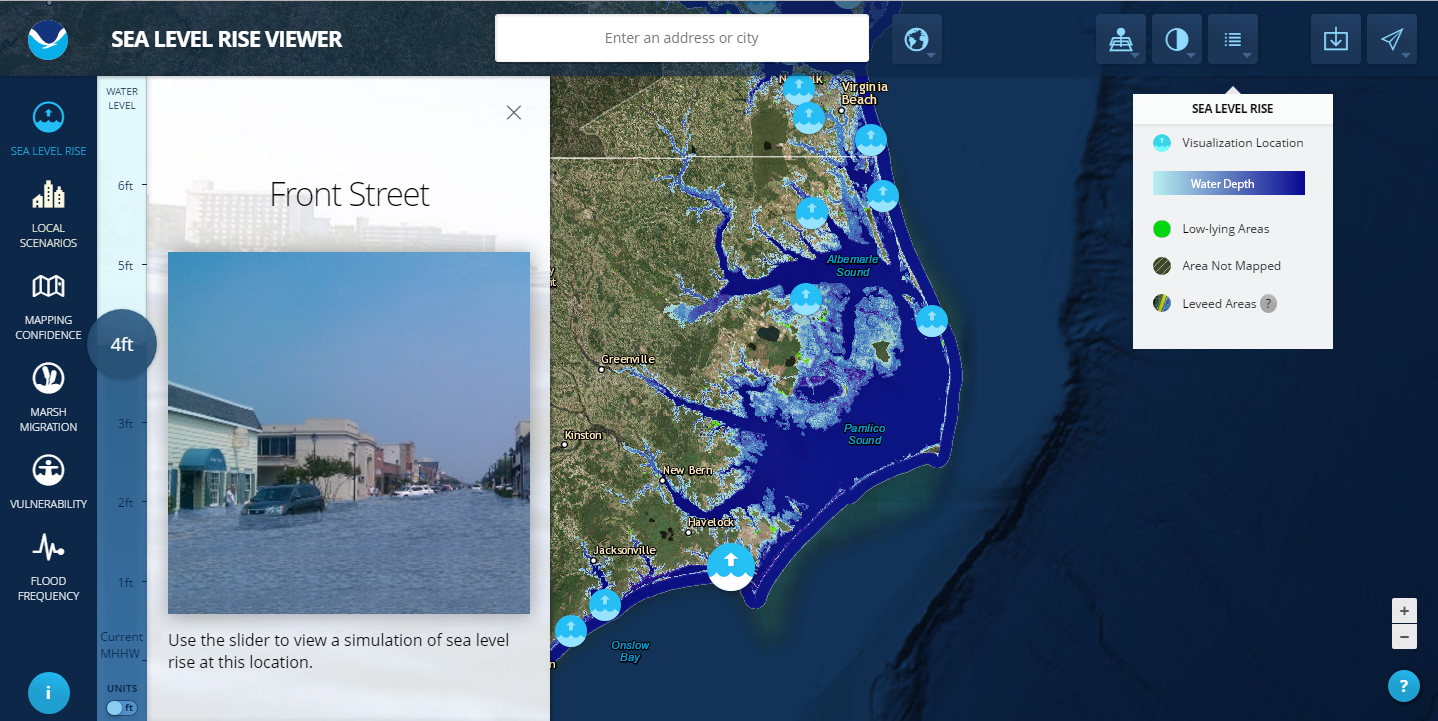
In the map viewer you’ll find sliders to change the water level, and even a simulation of sea level rise at a specific location.
For example, in the picture below you’ll see I have clicked on the closest scenario location to our office. In the viewer I have raised the slider to show what 4ft of water level increase will look like in downtown Beaufort along Front Street.